

The Science Behind Optimal Portfolio Construction
September 24, 2026The Science Behind Optimal Portfolio Construction
September 24, 2026
INSIGHTS
Know When to Hold 'Em:
Managing Volatility Without Panic
Everyone feels it. The market's been on a historic run, and there's a nagging sense that what goes up must come down. We're not in the business of predicting the next correction. What we are in the business of is making sure your portfolio, and you, can hold steady when it comes. That preparation matters more than the prediction ever could.
The Data Behind the Discomfort
A chart that's been circulating on LinkedIn, built using long-run market return data, makes the case better than we can. Looking at rolling historical periods, some multi-year stretches following a run-up like this one have returned close to flat on an annualized basis. Others have dipped slightly negative over similarly long stretches.
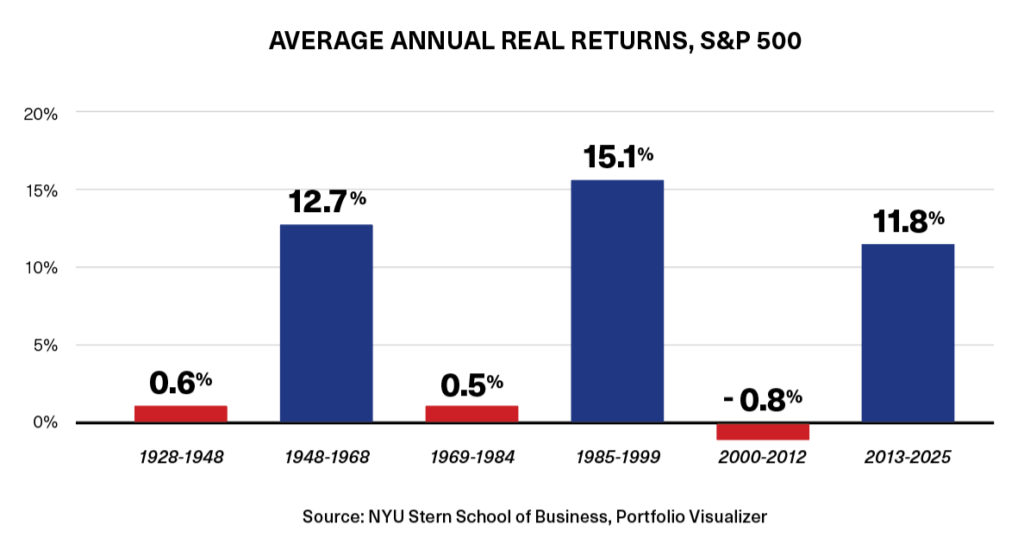
| PERIOD | ANNUALIZED RETURN** |
|---|---|
| Long-run average (all periods) | ~7%* |
| Some 10-year stretches after a run-up | Roughly flat |
| Some 12-year stretches after a run-up | Slightly negative |
*Adjusted for inflation; on a nominal basis, the long-run average is ~10%
**Figures are directional and illustrative, based on long-run historical market data. Past performance is not indicative of future returns. This chart is for educational purposes only and does not constitute investment advice or a recommendation to buy or sell any security.
The point isn't to alarm anyone. It's to normalize something that gets lost in years like this one: after periods of outsized gains, flat-to-negative stretches aren't rare. They're part of the pattern. Preparing for that possibility isn't pessimism; it's just math.
The Behavioral Traps
Two biases tend to do the most damage in moments like this.
The first is confirmation bias: once you believe the market will keep climbing, you start noticing everything that confirms it and discounting everything that doesn't.
The second is what's sometimes called the hot hand fallacy. Make ten shots in a row on the basketball court, and it feels inevitable that the next ten go in too. Markets play the same trick on investors chasing recent performance.
There's an old line worth remembering here: know when to hold 'em, know when to fold 'em. It's not about predicting the top. It's about recognizing when it's time to take some risk off the table, rather than assuming the streak will continue indefinitely.
Here's a story that illustrates why this matters in real dollars. A client in their early 40s, sitting on $1 million in gains, was fully invested in stocks at another advisor. Confident, and not unreasonably so, that they'd "be okay even if it dropped 50%." When we ran the numbers on continued withdrawals through a downturn scenario, the 30-year ending value came out roughly $25 million lower than the version where that drawdown didn't happen: about $9 million versus $25 million. "I can stomach a drop" and "the math works" are two very different statements, and the gap between them can be enormous.
How We Insulate Portfolios
Our philosophy: it's a marathon, not a sprint. There's no finish line to sprint toward, so the goal is consistent singles and doubles, not swinging for a home run on every pitch.
In practice, that can mean overweighting U.S. equities, value stocks, and dividend-growth companies with strong balance sheets and free cash flow. These are the holdings that tend to be green when everything else is red on down days.
Worth being honest about: this approach has lagged a red-hot S&P 500 in recent years. That's the trade-off for the downside protection, and it's one we think is worth making, but it's not free. There is real value in a manager’s ability to balance upside and downside capture, because doing that well is what drives long‑term results.
It's also worth saying plainly: even a well-built portfolio comes with emotional moments. A near-retirement client with a $3 million portfolio, split 80% bonds and 20% stocks, still calls us when a $10,000 to $15,000 daily swing shows up. That's normal. Feeling it doesn't mean the plan is wrong.
Making Risk Concrete
One of the tools we rely on is a narrowly adopted risk-tolerance system, built by a longtime industry contact and used by only a handful of firms. It looks at 30 years of market history and quantifies a portfolio's risk in dollars, not percentages.
Here's how it works in practice: we run a client's portfolio through it, and it produces a realistic 12-month range of dollar gains and losses. Clients react very differently once they see a real number attached to their actual portfolio. Some are comfortable with the range. Others clearly aren't, and that reaction becomes the starting point for a real conversation about adjusting the portfolio.
Compare that to a generic risk-scoring tool that spits out something like "your risk score is 67." That number doesn't mean anything to most people. A dollar range does.
The Takeaway
The goal was never to predict the correction. It's to make sure the portfolio, and the client, can hold steady through it.
If you'd like to see your own portfolio's real 12-month range rather than an abstract risk score, that's a conversation worth having.
Connect with us at info@eamoncap.com and take control of your financial future.
Eamon Capital Management, LLC (“Eamon”) is a registered investment advisor offering advisory services in the State of Pennsylvania and in other jurisdictions where exempted. Registration does not imply a certain level of skill or training.
This communication is for informational purposes only and is not intended as tax, accounting or legal advice, as an offer or solicitation of an offer to buy or sell, or as an endorsement of any company, security, fund, or other securities or non-securities offering. This communication should not be relied upon as the sole factor in an investment making decision.
Past performance is no indication of future results. Investment in securities involves significant risk and has the potential for partial or complete loss of funds invested. It should not be assumed that any recommendations made will be profitable or equal the performance noted in this publication.
The information herein is provided “AS IS” and without warranties of any kind either express or implied. To the fullest extent permissible pursuant to applicable laws, Eamon Capital Management, LLC (referred to as “Eamon”) disclaims all warranties, express or implied, including, but not limited to, implied warranties of merchantability, non-infringement, and suitability for a particular purpose.
All opinions and estimates constitute Eamon’s judgement as of the date of this communication and are subject to change without notice. Eamon does not warrant that the information will be free from error. The information should not be relied upon for purposes of transacting securities or other investments. Your use of the information is at your sole risk. Under no circumstances shall Eamon be liable for any direct, indirect, special or consequential damages that result from the use of, or the inability to use, the information provided herein, even if Eamon or a Eamon authorized representative has been advised of the possibility of such damages. Information contained herein should not be considered a solicitation to buy, an offer to sell, or a recommendation of any security in any jurisdiction where such offer, solicitation, or recommendation would be unlawful or unauthorized.