
Commentary – Second Quarter 2024
September 3, 2024
Commentary – Fourth Quarter 2024
February 21, 2025
Commentary – Second Quarter 2024
September 3, 2024
Commentary – Fourth Quarter 2024
February 21, 2025INSIGHTS
Commentary - Third Quarter 2023
Economic Data Softens But Market Rally Broadens
Our Quarterly Recap & Market Outlook provides insight into the forces shaping the market in 2024, beyond the headlines and noise. Connect with us at info@eamoncap.com and take control of your financial future.
QUARTERLY RECAP
The third quarter of 2024 ended with healthy returns across most major asset classes, despite several bouts of market volatility. A combination of weaker US economic data, an interest rate hike from the Bank of Japan and thin summer liquidity saw stocks hit particularly hard in early August. However, the long-anticipated start of the Federal Reserve’s ("Fed") rate cutting cycle in September, along with a less hawkish tone from Japanese policymakers and new stimulus in China, helped to soothe investor concerns and support a strong rally in stocks into quarter end.
Macroeconomic
GDP
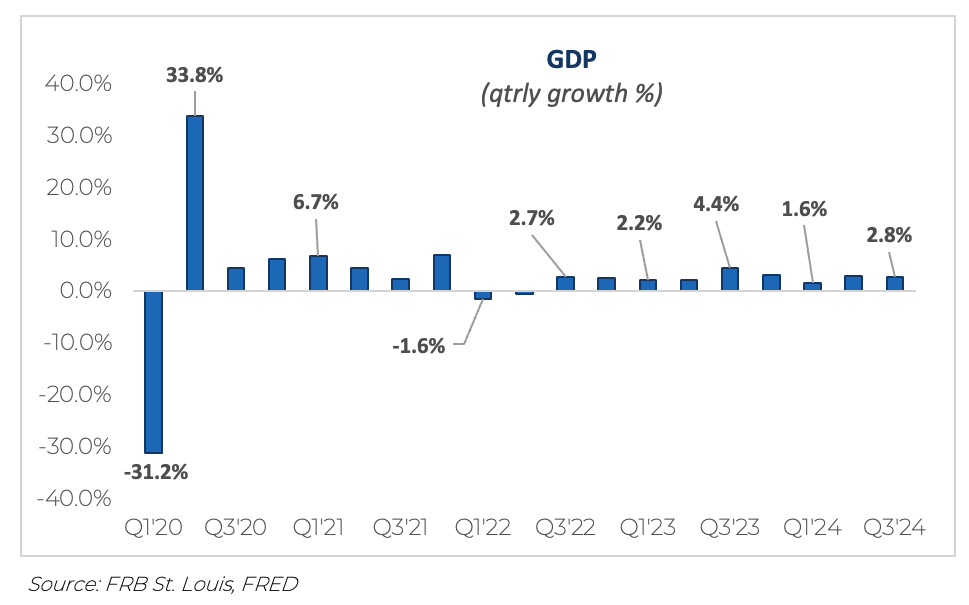
In 2024, the U.S. economy has shown a strong start with notable GDP growth. The U.S. Bureau of Economic Analysis (BEA) reported that the real GDP increased at an annual rate of 2.8% in the third quarter of 2024, down from 3.0% in the second quarter. This growth was driven by increases in consumer spending, exports and government spending.
As of the end of October 2024, the Federal Reserve Bank of Atlanta's GDPNow model estimates the real GDP growth rate for the fourth quarter to be 2.7%. The GDPNow model provides a "nowcast" of real GDP growth for the current quarter.
The International Monetary Fund (IMF) also raised its growth forecast for the U.S. to 2.8% for 2024, citing stronger-than-expected consumption and rising wages. The IMF highlighted the role of foreign-born workers in maintaining a strong labor market, which has helped keep inflation in check.
Despite these positive indicators, the U.S. economy faces challenges, including geopolitical tensions and potential trade wars. Also in focus is U.S. government deficit spending which has reached historic highs from pre-pandemic levels. For the last 50 years, the average ratio of government spending-to-GDP has been around 20%. Since 2020, it has averaged 26% of GDP through 2024. This equates to an additional $2.5 trillion of spending, on average, over that time period.
Overall, the U.S. economy's performance in 2024 has been a mix of strong growth and cautious optimism, with policymakers closely monitoring economic indicators to ensure sustainable growth.
Inflation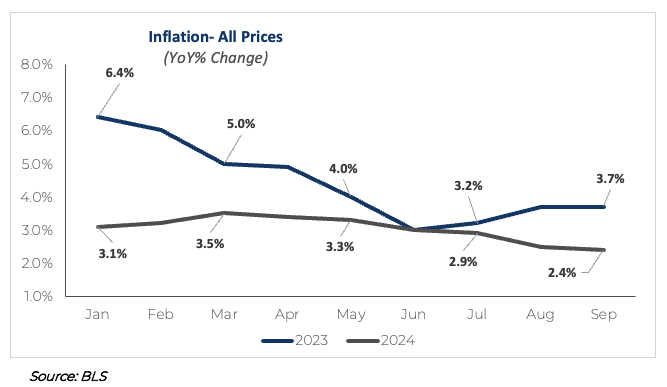
Inflation trends continue to show a gradual decline, reflecting the impact of various economic policies and global factors. The U.S. Bureau of Labor Statistics reported that the Consumer Price Index (CPI) rose by +2.4% in September 2024, marking the lowest annual increase since February 2021. This inflation reading further solidified the trend reversal of the rapid price increases seen since the beginning of the pandemic.
Despite the downward trend, certain sectors, such as housing, continue to experience stubbornly high prices. Shelter inflation, for instance, was up +4.9% from a year ago in September. This is double the headline number and can be attributed to inventory shortages and slow to adjust rent prices.
Overall, while the downward trend in inflation is encouraging, the persistence of high prices in certain sectors highlight the complexities of managing inflation in the current economic environment. Looking ahead, expectations are for the inflation rate to remain around 2.4% by the end of the year. With this backdrop of declining inflation, the market is pricing in up to two more rate cuts by the Fed through the end of 2024.
Labor Market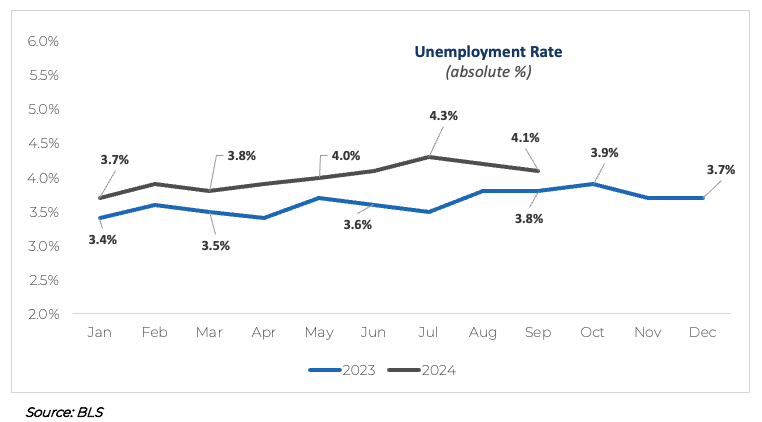
The U.S. labor market has experienced some challenges but remains resilient. As of September 2024, the unemployment rate stands at 4.1%, a slight increase from 3.8% a year earlier. The labor force participation rate has remained relatively stable, indicating more people are staying in or entering the workforce.
Nonfarm payrolls increased by 254,000 jobs in September 2024, with notable gains in food services, health care, government, social assistance, and construction. However, the number of long-term unemployed (those jobless for 27 weeks or more) remains elevated at 1.6 million, accounting for 23.7% of all unemployed people.
This comes after a significant undershoot with August’s report showing significant slowing and payroll levels well below expectations in combination with substantial downward revisions from previous reports. For the month, 142,000 jobs were added slightly above July but well below estimates. For June and July, total jobs were revised down by 89,000.
Overall, while the labor market continues to add jobs, the slight uptick in the unemployment rate and the persistence of long-term unemployment suggests there are still areas of concern. As a result, it has been clear from recent meetings the Fed has shifted from more of an inflation focus to a labor market focus in weighing their future policy decisions.
Financial Markets Performance Recap
Stocks
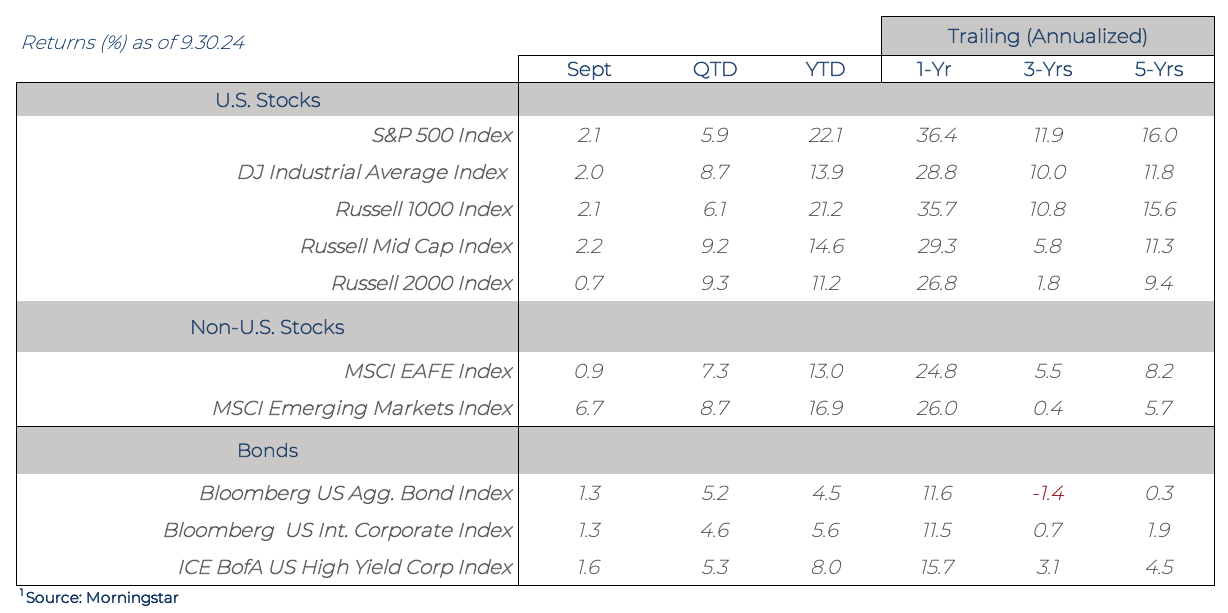
For the third quarter, all stock indices we follow were in positive territory by quarter’s end. The tech stock rally experienced so far in 2024 slowly broadened to other sectors and was the primary driver of overall absolute performance. Subsequently, this ushered in a pause in tech rally.
Mid cap and small cap trounced large cap as shown by the Russell Mid Cap Index +9.2% and the Russell 2000 Index +9.3% versus the large cap S&P 500 Index up +5.9% and Russell 1000 Index +6.1%. This was a sharp reversal from the negative performance seen by mid cap and small cap in the second quarter. The Nasdaq 100 Index, heavily weighted toward technology stocks, rose only +2.1% which was quite a departure from prior period performance.
From a style perspective, value outperformed growth across all market capitalizations in the U.S. and abroad. The largest disparity was in large cap at +6.2% (Russell 1000 Growth Index +3.2% vs Russell 1000 Value Index +9.4%). In mid cap and small cap the gap was a bit narrower at +3.6% for mid cap (Russell Mid Growth Index +6.5% vs Russell Mid Value Index +10.1%) and +1.8% in small cap (Russell 2000 Growth Index +8.4% vs Russell 2000 Value Index +10.2%).
Internationally, performance was similar to the U.S. markets on a relative basis. Developed markets, as shown by the MSCI EAFE Index, were up +7.3% during the quarter. Emerging markets were better on the margin as shown by the MSCI Emerging Markets Index +8.7%. Emerging market stocks outperformed due to tailwinds from China’s central bank stimulus measures, rate cuts in the U.S., and the weakening of the U.S. dollar.
Bonds
The Bloomberg Aggregate Index, the most widely followed bond index, returned +5.2% for the quarter. This was its second best quarter over the last three years pushing it to +4.2% for the last nine months of 2024 and +11.7% over the last twelve months. This is a large reversal from the negative returns seen from the asset class since the Fed began raising rates in 2022.
Investment-grade corporate bonds and below-investment grade corporate bonds, i.e., junk bonds, performed similarly as shown by the higher credit quality Bloomberg Intermediate Credit Index +4.6% and the lower credit quality BofA US High Yield Corporate Index +5.3%.
These bond returns were driven largely by a massive market repricing lower of key interest rates ahead of the Fed kicking off its rate cutting cycle at the September meeting. The 10-year U.S. Treasury started the quarter at 4.45% and rapidly declined, by almost 1%, to a bottom of 3.62% by September 30th. This dramatic drop in U.S. Treasury yields helped bond returns keep pace with stocks returns.
From a risk-adjusted perspective, bond returns were close to double those of U.S. large cap stocks. This means the ratio of return received relative to the amount of inherent risk was much higher.
A focus on risk-adjusted returns, has been an integral part of our investment thesis over the last couple of years. Given the significant selloff in bonds since 2022, the prospect for returns outpacing stocks on a risk-adjusted basis is quite compelling for investors.
Want to uncover the complete picture of how the market might unfold in 2024? Our exclusive newsletter delves into more than just current trends.
You'll discover:
Our in-depth market outlook: Uncover the forces shaping the coming months and their potential impact on your portfolio.
Expert portfolio positioning: See how we strategically adjust portfolios to capture opportunities amidst shifting market conditions.
Actionable insights: Gain tailored guidance to navigate challenges and capitalize on potential upsides.
Simply connect with us at info@eamoncap.com and take control of your financial future.
Eamon Capital Management, LLC (“Eamon”) is a registered investment advisor offering advisory services in the State of Pennsylvania and in other jurisdictions where exempted. Registration does not imply a certain level of skill or training.
This communication is for informational purposes only and is not intended as tax, accounting or legal advice, as an offer or solicitation of an offer to buy or sell, or as an endorsement of any company, security, fund, or other securities or non-securities offering. This communication should not be relied upon as the sole factor in an investment making decision.
Past performance is no indication of future results. Investment in securities involves significant risk and has the potential for partial or complete loss of funds invested. It should not be assumed that any recommendations made will be profitable or equal the performance noted in this publication.
The information herein is provided “AS IS” and without warranties of any kind either express or implied. To the fullest extent permissible pursuant to applicable laws, Eamon Capital Management, LLC (referred to as “Eamon”) disclaims all warranties, express or implied, including, but not limited to, implied warranties of merchantability, non-infringement, and suitability for a particular purpose.
All opinions and estimates constitute Eamon’s judgement as of the date of this communication and are subject to change without notice. Eamon does not warrant that the information will be free from error. The information should not be relied upon for purposes of transacting securities or other investments. Your use of the information is at your sole risk. Under no circumstances shall Eamon be liable for any direct, indirect, special or consequential damages that result from the use of, or the inability to use, the information provided herein, even if Eamon or a Eamon authorized representative has been advised of the possibility of such damages. Information contained herein should not be considered a solicitation to buy, an offer to sell, or a recommendation of any security in any jurisdiction where such offer, solicitation, or recommendation would be unlawful or unauthorized.
