Commentary – First Quarter 2024
June 27, 2024
Commentary – Third Quarter 2024
November 18, 2024
Commentary – First Quarter 2024
June 27, 2024
Commentary – Third Quarter 2024
November 18, 2024INSIGHTS
Commentary - Second Quarter 2023
Inflation's Loosening Grip Amidst A Softening Economic Outlook
Our Quarterly Recap & Market Outlook provides insight into the forces shaping the market in 2024, beyond the headlines and noise. Connect with us at info@eamoncap.com and take control of your financial future.
QUARTERLY RECAP
In the second quarter of 2024, the U.S. economy stayed resilient in an environment where inflation and interest rates remained higher than expectations. However, recent data is pointing to a possible slowing in headline economic conditions which many say is signaling a rate cut to be around the corner.
Macroeconomic

GDP
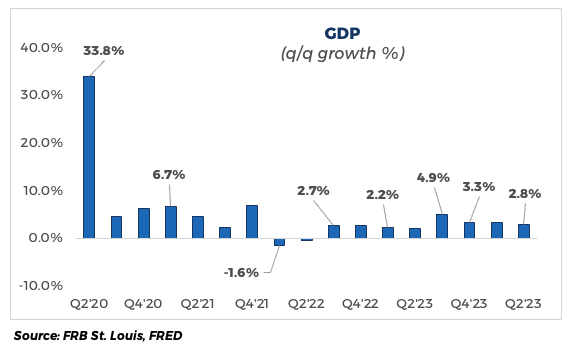
So far for 2024, U.S. GDP growth has been marked by uncertainty. Estimates for growth released in May showed increases in consumer spending, residential fixed investment, nonresidential fixed investment, and state and local government spending. This was elevated when compared to the first quarter.
When the dust settled, it was a tale of two reports. In the first quarter, real GDP increased at an annual rate of +1.4% which was well below consensus forecasts of +2.5%. This was overshadowed by the results for the second quarter reported at +2.8% and well above its forecast of +2.1%.
Overall, U.S. GDP growth has been hotly debated among economic forecasters. Despite inflation and interest rate headwinds, some strategists such as S&P Global Ratings are forecasting U.S. real GDP growth of +2.5% for this year. However, others such as The Conference Board and J.P. Morgan are predicting a negative trend, with growth slowing to +0.7% for 2024. The final results will hinge on the Federal Reserve's (“Fed”) policy path and whether it remains restrictive or moves to a more accommodative posture.
Inflation
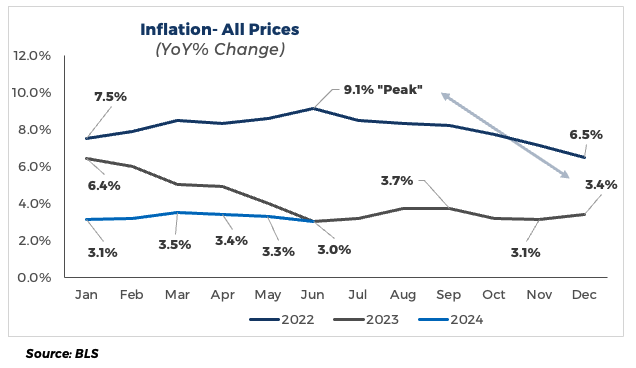
The monthly inflation rate showed a downward trend as the Consumer Price Index (CPI) peaked early in the year only to fall to its lowest level by quarter’s end. For the quarter, consensus forecasts had the average annual rate at 3.4%, up from 2.5% in previous surveys.
In April, inflation rose less-than-expected at 3.4%, dropped to 3.3% by May, and ended June firmly at 3.0% (a floor not broken yet in 2024). This was largely due to robust consumer spending and higher energy prices. However, after adjusting for volatile food and energy prices, the trend continues to decline inline with the historical gauges of the Fed.
Looking ahead, expectations are for the inflation rate to fall to 2.7% by the end of the 2024.
Labor Market
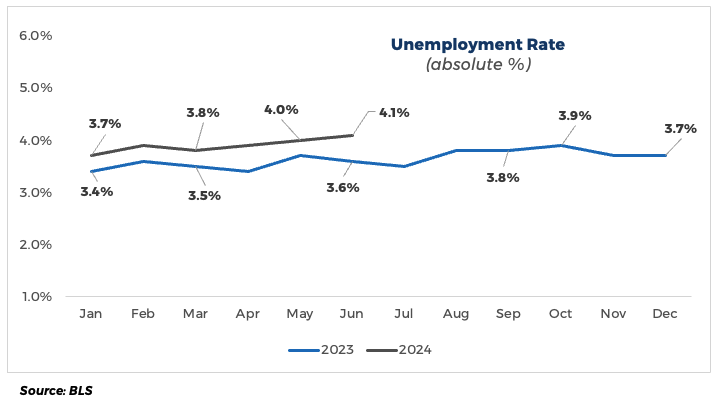
The U.S. labor market showed mixed signals. To begin the quarter, the unemployment rate was stable at 3.8% when the economy added 303,000 jobs in March. However, the rate increased +0.1% each month thereafter to peak at 4.1% by the end of June, pointing to signs of a softening labor market. This reinforced expectations that the Fed will cut interest rates soon.
Despite the rise in unemployment, the labor market is still healthy especially those sectors not impacted by the pandemic. Only in the last few months has softening started to emerge. This continued trend will only help the fight against inflation by reducing wage pressures. The Fed has indicated from the beginning, it expects to see some pain in the labor market before there will be any
meaningful progress against inflation.
Markets

Equities
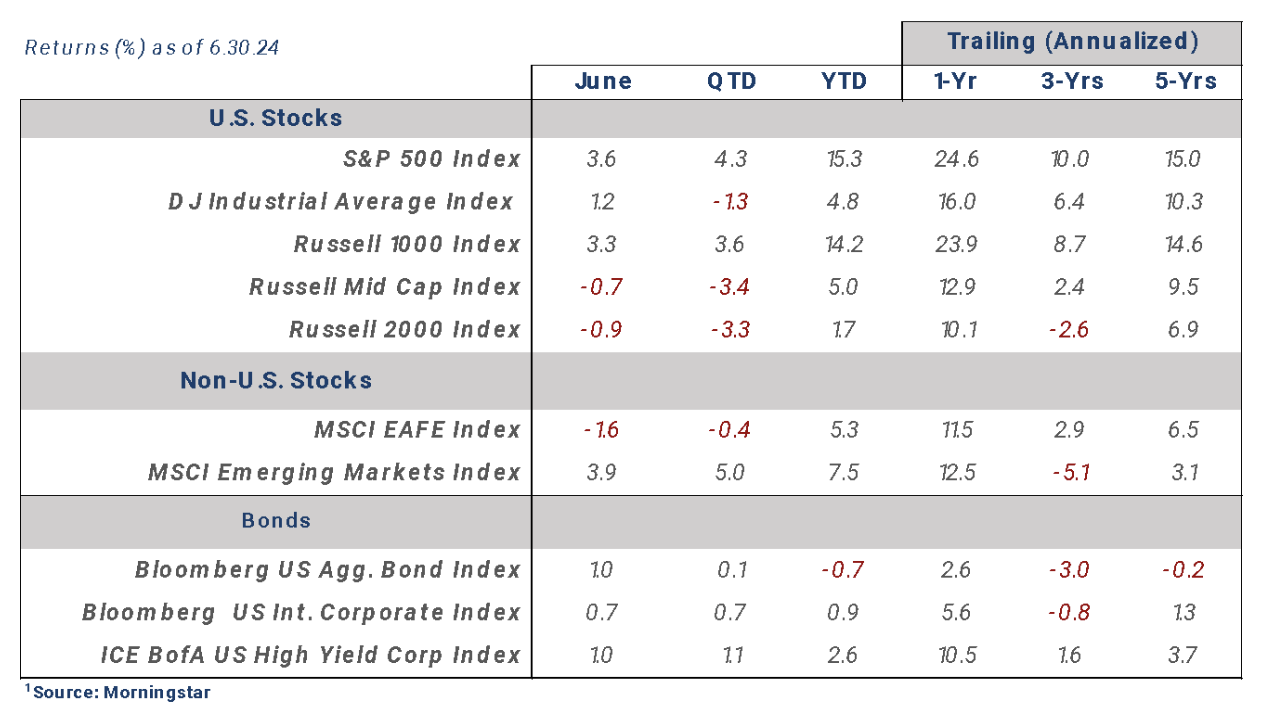
After the stellar rally seen over the last year, U.S. stocks proved to be a mixed bag during the second quarter. Large cap stocks were the sole positive performers as shown by the S&P 500 Index up +4.3% and Russell 1000 Index +3.6%. However, farther down the capitalization spectrum returns were in the red as shown by the Russell Mid Cap Index -3.4% and the Russell 2000 Index - 3.3%
In large cap, there was a divergence between styles as growth outperformed value by over +10% (Russell 1000 Growth Index +8.3% vs Russell 1000 Value Index -2.2%). In mid cap and small cap stocks there was little to no difference in style with both matching each other’s negative performance during the quarter. Despite the significant headwinds of elevated interest rates, stubborn inflation
and multiregional geopolitical risks, investors once again gravitated toward the most speculative growth-oriented technology companies. The Nasdaq 100 Index, which is heavily weighted toward technology, rose +8.3% during the quarter, and has increased +31.0% over the last twelve months ending June 2024.
Internationally, performance was more varied and subdued on a relative basis. Developed markets, as shown by the MSCI EAFE Index, saw negative performance of -0.4% during the quarter. Growth underperformed value, the opposite of to its U.S. counterparts. Emerging markets, on the other hand, experienced better returns outperforming their developed market counterparts as shown by the MSCI Emerging Markets Index +5.0%. Emerging market stocks outperformed due to strong tech sector performance, positive surprise political
developments in India and Mexico, a Chinese market recovery, and resilience in certain sectors despite US dollar strength.
Bonds
The Bloomberg Aggregate Index, the most widely followed bond index, rebounded from its lows in late-April to finish the quarter in positive territory at +0.1%. However, it remained down for the year at -0.7%. As investors attempted to gauge the Fed’s next move, U.S. Treasury yields, while seemingly stable relative to the last two years, still showed above average volatility. The 10-year
Treasury climbed 70 basis points (+0.7%) only to fall 40 basis points (-0.4%) and end the quarter largely where it began around 4.30%.
Investors continued to embrace risk assets causing credit spreads to tighten and benefit corporate bond returns. Below investment grade bonds outperformed their higher quality counterparts as shown by the difference between the BofA U.S. High Yield Corp Index +1.5% and the Bloomberg U.S. Intermediate Credit Index +0.2%.
Note: the additional interest rate compensation received by corporate bondholders over and above equivalent U.S Treasuries is referred to as a “spread”. The amount received will depend on the quality of the underlying security. For example, investment grade corporate bonds (rated BBB and higher) are currently receiving +1.00% more relative to below investment grade bonds (rated BB and lower), or junk bonds, receiving an additional +3.25%. The riskier a bond, the higher the spread.
Outlook: Cracks Forming Across the Investment Landscape
Our investment thesis for softening economic growth, declining inflation, the Fed shifting to a more accommodative stance, .e.g., lower interest rates, and declining stock market valuations is being solidified with each new monthly release of a economic data.
In the past year, as communicated and in anticipation of a reversal in current market trends, we have increased our exposure to high-quality stocks in the U.S., increased general exposure to non-U.S. stocks, and increased duration in bond allocations, i.e., moving from shorter maturity bonds to longer maturity bonds. See below for a brief explanation on each of our portfolio themes.
- High quality stocks are defined as those with predictable revenue and earnings growth, strong balance sheets backed by physical assets (buildings, machinery, equipment, etc.), high free cash flow, and dividend payers with increasing dividends. We like these types of companies as they tend to outperform in market downturns and slowing economic growth they tend to outperform in market downturns and slowing economic growth environments. This is opposite to their more speculative growth-oriented environments. This is opposite to their more speculative growth-oriented peers that derive a large percentage of their value from subjective peers that derive a large percentage of their value from subjective earnings forecasts farther out in the future.earnings forecasts farther out in the future.
- Bond prices increase when interest rates fall. Simply put, and assuming all else equal, longer maturity bonds will outperform shorter maturity bonds by a significant margin when interest rates decline. We have held an overweight to shorter maturity bonds since the Fed started their hiking cycle, .e.g., increasing interest rates, over two years ago. However, we are now closer to the start of an easing cycle, e.g., decreasing interest rates. Therefore, the probability of rates coming down is higher than rates going up and we are taking advantage of it by allocating toward longer maturity bonds.
- Non-U.S. stocks have not appreciated at the same rate as U.S. stocks during the recent post-pandemic runup. Some research puts current U.S. stock market valuations at 2-3x historical averages relative to non-U.S. developed market stock valuations. Further, most major global market central banks began their hiking cycles much earlier than the Fed and have the seen the impacts of declining growth and inflation already. However, we are mindful of geopolitical risks with the potential of causing increased volatility and are allocating accordingly. Ultimately, we believe non-U.S. markets offer better value compared to their U.S.believe non-U.S. markets offer better value compared to their U.S. counterparts especially in larger capitalizations.
The major sell-off in early August (July 31st - August 5th), albeit short lived, offered a glimpse into what a longer-term protracted downturn might look like if economic data slows faster than what is already priced in by the market. Fortunately, our portfolios were mostly in the green during that stretch.
We believe there still to be consequences from the fastest rate hiking cycle in the history of the Fed. There have been several big dominoes to fall already only to have the market largely shrug it off. However, it is our opinion there are more dominoes on the way whether in commercial real estate, carry trade unwinds (as seen with the yen in early August), or those still yet to be seen.
Overall, stock markets are forward looking, meaning prices are based on what the collective market sentiment believes stock prices will be six- to -twelve- months into the future. At the moment, sentiment seems to be turning a blind eye to softening underlying corporate and economic fundamentals while also assuming corporations will power through it unscathed. If an investor has been around long enough, most will all agree when the words, ‘this time it is different” are commonplace from television personalities and other
business influencers, it usually time to hunker down and put on the proverbial helmet as it is about to get interesting.
Want to uncover the complete picture of how the market might unfold in 2024?
Our exclusive newsletter delves into more than just current trends. You'll discover:
Our in-depth market outlook: Uncover the forces shaping the coming months and their potential impact on your portfolio.
Expert portfolio positioning: See how we strategically adjust portfolios to capture opportunities amidst shifting market conditions.
Actionable insights: Gain tailored guidance to navigate challenges and capitalize on potential upsides.
Simply connect with us at info@eamoncap.com and take control of your financial future.
Eamon Capital Management, LLC (“Eamon”) is a registered investment advisor offering advisory services in the State of Pennsylvania and in other jurisdictions where exempted. Registration does not imply a certain level of skill or training.
This communication is for informational purposes only and is not intended as tax, accounting or legal advice, as an offer or solicitation of an offer to buy or sell, or as an endorsement of any company, security, fund, or other securities or non-securities offering. This communication should not be relied upon as the sole factor in an investment making decision.
Past performance is no indication of future results. Investment in securities involves significant risk and has the potential for partial or complete loss of funds invested. It should not be assumed that any recommendations made will be profitable or equal the performance noted in this publication.
The information herein is provided “AS IS” and without warranties of any kind either express or implied. To the fullest extent permissible pursuant to applicable laws, Eamon Capital Management, LLC (referred to as “Eamon”) disclaims all warranties, express or implied, including, but not limited to, implied warranties of merchantability, non-infringement, and suitability for a particular purpose.
All opinions and estimates constitute Eamon’s judgement as of the date of this communication and are subject to change without notice. Eamon does not warrant that the information will be free from error. The information should not be relied upon for purposes of transacting securities or other investments. Your use of the information is at your sole risk. Under no circumstances shall Eamon be liable for any direct, indirect, special or consequential damages that result from the use of, or the inability to use, the information provided herein, even if Eamon or a Eamon authorized representative has been advised of the possibility of such damages. Information contained herein should not be considered a solicitation to buy, an offer to sell, or a recommendation of any security in any jurisdiction where such offer, solicitation, or recommendation would be unlawful or unauthorized.
