
Commentary – Fourth Quarter 2024
February 21, 2025
Commentary – Second Quarter 2025
June 12, 2025Commentary – Fourth Quarter 2024
February 21, 2025Commentary – Second Quarter 2025
June 12, 2025INSIGHTS
Commentary - First Quarter 2025
Growth Reality Check:
Repricing in Progress?
Our Quarterly Recap & Market Outlook provides insight into the forces shaping the market – beyond the headlines and noise. Connect with us at info@eamoncap.com and take control of your financial future.
QUARTERLY RECAP
In the first quarter of 2025, the U.S. markets faced significant challenges. The Federal Reserve opted to hold rates steady at 4.25%–4.50%, amid persistent inflation concerns and uncertainty over the Trump administration’s tariff policies. The S&P 500 Index declined by -4.3%, marking its worst quarterly performance in over two years. The tech-heavy Nasdaq Composite fell by -8.1%, while the Dow Jones Industrial Average saw a more modest decline of -0.9%. The bond market also saw turbulence as yields rose early on only to reverse by quarter end allowing it to eke out a positive return, as reflected in the Bloomberg U.S. Aggregate Bond Index's +2.8% gain.
US Economic Growth
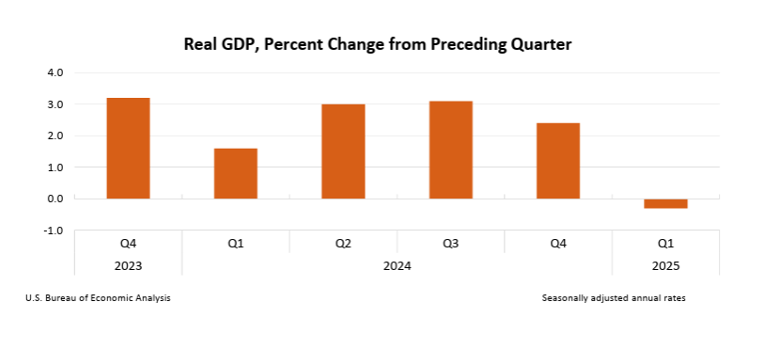
The U.S. economy showed signs of slowing in early 2025. Real GDP decreased at an annualized rate of -0.3% in the first quarter, following a +2.4% increase in the fourth quarter of 2024. The downturn was primarily driven by a surge in imports ahead of new tariffs, as well as a decrease in government spending. Consumer spending and business investment provided some support but were not enough to offset the broader economic slowdown.
US Inflation
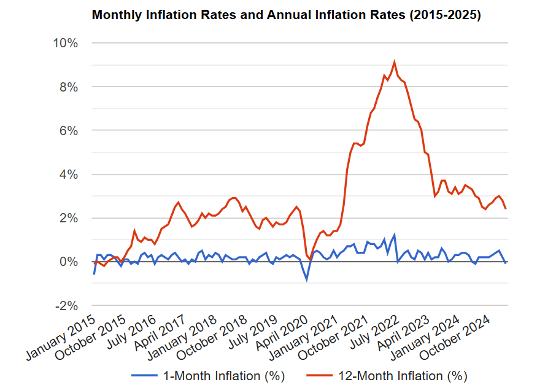
Inflation continued to ease but remained a concern. The Consumer Price Index (CPI) rose by +2.4% year-over-year as of March 2025, down from +2.8% in February. Core inflation, which excludes food and energy prices, also showed signs of moderation, reflecting the Federal Reserve's efforts to bring inflation closer to its 2% target. However, rising costs in key areas such as housing and utilities continued to weigh on consumers.
US Labor Market
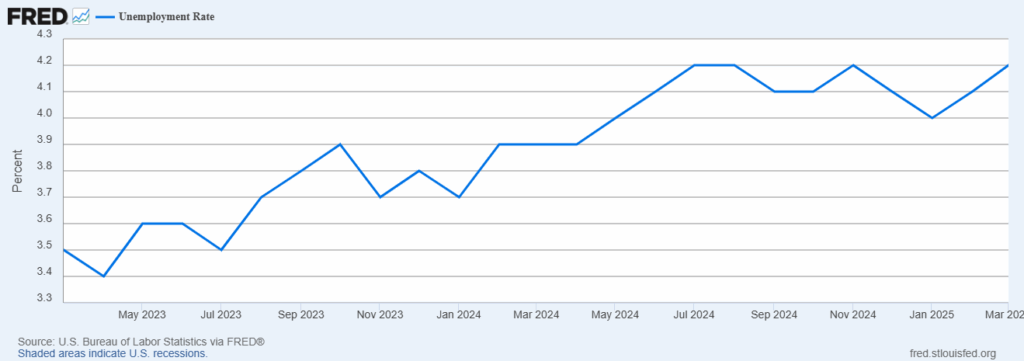
The U.S. labor market remained relatively stable but showed signs of cooling. The unemployment rate held steady at 4.2% in March 2025. Total nonfarm payroll employment increased by 228,000 in March, with notable gains in healthcare, social assistance, and transportation. However, job openings declined to 7.2 million, the lowest level since September 2024, indicating a softening in labor demand. Wage growth remained modest, and layoffs in certain sectors, such as retail and federal government, highlighted ongoing headwinds for an already stressed labor market.
Financial Markets Performance Recap
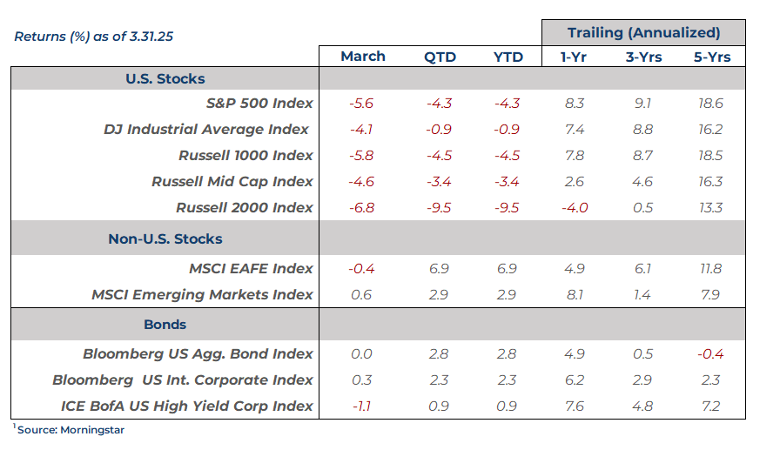
Stocks
For the quarter, all U.S. stock indices ended in negative territory, reflecting increased market volatility, uncertainty around Federal Reserve policy, and concerns over the Trump administration’s economic and fiscal plans.
Large-cap stocks underperformed and posted moderate losses. The S&P 500 Index declined -4.3%, while the Russell 1000 Index fell -4.5%. Mid-cap stocks were the top performer on a more moderate decline, with the Russell Mid Cap Index down -3.4%. Small caps struggled the most, with the Russell 2000 Index falling -9.5%, indicating heightened investor risk aversion toward smaller, more leveraged companies. The Nasdaq 100 Index posted a -8.1% decline, though its losses were somewhat cushioned relative to other tech-heavy growth indices.
Investor sentiment shifted to cautionary on mid and small caps, as concerns over the potential impacts from an economic slowdown along with stubbornly high levels of general interest rates, weigh heavy on balance sheets and future growth expectations.
Value significantly outperformed growth across all market capitalizations in the U.S. and abroad. The largest disparity was in large cap, where value outperformed growth by +12.1% (Russell 1000 Value Index +2.1% vs. Russell 1000 Growth Index -10.0%). Mid cap stocks followed a similar trend, with value ahead by +5.0% (Russell Mid Cap Value Index -2.1% vs. Russell Mid Cap Growth Index -7.1%). Small caps saw the smallest gap, with value outperforming by +3.4% (Russell 2000 Value Index -7.7% vs. Russell 2000 Growth Index -11.1%).
International equities delivered stronger returns relative to U.S. markets, supported by central bank policy shifts, global trade developments, and currency movements. As also seen in the U.S., value stocks outperformed growth stocks in developed markets. The MSCI EAFE Value Index surged +11.6%, significantly outpacing the MSCI EAFE Growth Index, which rose +2.1%. The MSCI Emerging Markets Index rose +2.9%, reflecting steady economic recovery and improving investor sentiment for this more volatile sector.
Bonds
The quarter brought positive results across most major fixed-income indices, as inflation concerns eased and investors adjusted their expectations around Federal Reserve policy. Treasury yields moved in mixed fashion but longer-term yields ultimately fell by quarter-end.
Interest rate sensitivity and corporate spread movements played a key role in performance. Bonds more sensitive to interest rate changes outperformed those with lower sensitivity. Corporate bond spreads—the yield difference between corporate and risk-free government bonds—reflect investor demand for additional return in exchange for greater risk. When spreads widen, bond performance tends to decline.
The Bloomberg U.S. Aggregate Bond Index gained +2.8%, buoyed by falling Treasury yields. However, widening corporate credit spreads weighed on corporate bond valuations, moderating overall returns.
Long-term Treasuries saw the biggest boost from falling yields, with the Bloomberg Long U.S. Treasury Index up +4.7%. Intermediate-term bonds posted steadier gains, rising +2.6%, while short-term bonds gained +1.6%, as rising corporate spreads largely offset declining Treasury yields. High yield corporate bonds advanced +0.9%, holding onto positive returns despite widening credit spreads.
Emerging market debt posted strong gains, as global currencies strengthened against the U.S. dollar in response to shifting financial conditions. This momentum was reflected in the JPM GBI-EM Global Diversified Index, a non-U.S. dollar index, which advanced +4.3%.
Want to uncover the complete picture of how the market might unfold? Our exclusive newsletter delves into more than just current trends.
You'll discover:
Our in-depth market outlook: Uncover the forces shaping the coming months and their potential impact on your portfolio.
Expert portfolio positioning: See how we strategically adjust portfolios to capture opportunities amidst shifting market conditions.
Actionable insights: Gain tailored guidance to navigate challenges and capitalize on potential upsides.
Simply connect with us at info@eamoncap.com and take control of your financial future.
Eamon Capital Management, LLC (“Eamon”) is a registered investment advisor offering advisory services in the State of Pennsylvania and in other jurisdictions where exempted. Registration does not imply a certain level of skill or training.
This communication is for informational purposes only and is not intended as tax, accounting or legal advice, as an offer or solicitation of an offer to buy or sell, or as an endorsement of any company, security, fund, or other securities or non-securities offering. This communication should not be relied upon as the sole factor in an investment making decision.
Past performance is no indication of future results. Investment in securities involves significant risk and has the potential for partial or complete loss of funds invested. It should not be assumed that any recommendations made will be profitable or equal the performance noted in this publication.
The information herein is provided “AS IS” and without warranties of any kind either express or implied. To the fullest extent permissible pursuant to applicable laws, Eamon Capital Management, LLC (referred to as “Eamon”) disclaims all warranties, express or implied, including, but not limited to, implied warranties of merchantability, non-infringement, and suitability for a particular purpose.
All opinions and estimates constitute Eamon’s judgement as of the date of this communication and are subject to change without notice. Eamon does not warrant that the information will be free from error. The information should not be relied upon for purposes of transacting securities or other investments. Your use of the information is at your sole risk. Under no circumstances shall Eamon be liable for any direct, indirect, special or consequential damages that result from the use of, or the inability to use, the information provided herein, even if Eamon or a Eamon authorized representative has been advised of the possibility of such damages. Information contained herein should not be considered a solicitation to buy, an offer to sell, or a recommendation of any security in any jurisdiction where such offer, solicitation, or recommendation would be unlawful or unauthorized.